
Volume 8, Issue 3 (August 2021)
Avicenna J Neuro Psycho Physiology 2021, 8(3): 115-123 |
Back to browse issues page


Download citation:
BibTeX | RIS | EndNote | Medlars | ProCite | Reference Manager | RefWorks
Send citation to:


BibTeX | RIS | EndNote | Medlars | ProCite | Reference Manager | RefWorks
Send citation to:
Yaghoubian E, Sadeghi Bajestani G, Namdari H. Differentiation of Healthy Individuals from Those with Autism Spectrum Disorders using Information Graph of Complementary Opposites. Avicenna J Neuro Psycho Physiology 2021; 8 (3) :115-123
URL: http://ajnpp.umsha.ac.ir/article-1-244-en.html
URL: http://ajnpp.umsha.ac.ir/article-1-244-en.html


1- Bachelor of Biomedical Engineering, Imam Reza International University, Iran, Mashhad
2- International University of Imam Reza (AS) ,g.sadeghi@imamreza.ac.ir
3- Master of Biomedical Engineering, Islamic Azad University of Mashhad, Iran, Mashhad
2- International University of Imam Reza (AS) ,
3- Master of Biomedical Engineering, Islamic Azad University of Mashhad, Iran, Mashhad
Full-Text [PDF 1027 kb]
(1124 Downloads)
| Abstract (HTML) (3406 Views)
In the past few years, some studies have been carried out using the Mandala pattern on brain data including that conducted by Sadeghi Bajestani et al. (2017) in which two groups of control and ASD were used and the results were consistent with those of the present study. In this study, the Mandala pattern was used as the main strategy for distinguishing ASD from NC individuals, since this pattern was not formed in the NC group [7].
Materials and Methods
No filters have been used in the present study since based on the authors’ viewpoint, there is no standard method to eliminate undesirable items from the vital signal without jeopardizing the information and creativity. It is worth mentioning that part of the important information was lost due to the application of conventional filters [8,9,10]. The block diagram of this study is presented in Figure 3.
Recording Protocol in Research
The recording was carried out using a 10-20 system, a well-known international method. This system consists of several electrodes, the positions of which are shown in Figure 4.
In total, 10 individuals out of 20 participants in this study had ASD and the other 10 were included in the NC group. The mean ±SD age of participants was estimated at 8±5 years old. The recording was performed in an acoustic room equipped with a chair and a monitor to display cartoons for both groups.
Recording steps; content and time specifications; method of implementation of triple recording steps
In the first stage (or baseline), the child sat motionless on a chair for about one minute in a completely normal form. In the next stage, a cartoon was played for five minutes with sound. Afterward, the same cartoon was displayed again soundless. Recording for all NC children was performed similarly. In the stage when cartoons were displayed with sound, such questions as word completion and word guesses were raised for autistic children. In the third stage, the same images (including objects, animals, and fruits) were displayed without background sound.
Recording data tool
The recording device and software used in this study included FlexComp Infiniti Encoder and BioGraph Infiniti, respectively. The device (256 Hz, 12-bit ADC) had the capability to record and collect biological data from brain activity online and synchronously.
Opposite concept
Although the universality of duality has been widely recognized, there are divergent views as to the nature of the opposition. Oppositions change performance and hence produce information. Information is encoded in opposition, examples of which include positive and negative states of computer components, true and false in logic, action, and resting potential in neurons [11]. The computation of sine and cosine of each term in a time series allows one to explore the opposite components of a process when only a one-time series is available. The interaction of opposites plays a fundamental role in natural and human processes. The sine and cosine of each term in the series were calculated to investigate the opposition. As a result, a single time series was decomposed into two complementary surrogate series (sine and cosine transform). Sine and cosine are an example of complementary opposites, they wax and wane out of phase (displayed by pi/2). It should be noted that such rising and falling do not occur independently. Sine and cosine transform lead to the provision of a two-dimensional framework to project a time series and examine the relationship between the opposite components. Trigonometric transformations were introduced as a strategy to develop numerical analyses and plots [12].
Trigonometric model
Trigonometric analysis decomposes a complex series into two orthogonal and opposite components. Trigonometric transformations are widely used in time series analysis. Fourier analysis decomposes a complex time series into a (potentially infinite) series of sine and cosine components. The trigonometric decomposition into sine and cosine components portrays informational oppositions. The relation between sine and cosine functions is considered as a mathematical model for complementary opposition since they include reciprocity and orthogonal relations [12]. Linear (diagonal), orthogonal (two linear orthogonal opposite), and partial (dotted lines in each semicircle) opposites are presented in Figure 5.
Complementary plots
Complementary plots are generated by plotting the cosine and sine transforms in X and Y axes as well as drawing a straight line between successive points to represent transitions. In the complementary plot, the value of each term in the time series corresponds to a point in a circumference (Figure 6). The vertical axis represents the sine scale while the horizontal axis denotes the cosine scale, with zero in both scales corresponding to the center of circumference [12]. The Mandala pattern was achieved from the successive transitions between the sinus and cosine. The evaluation of brain data between the NC and ASD groups was carried out based on this pattern.
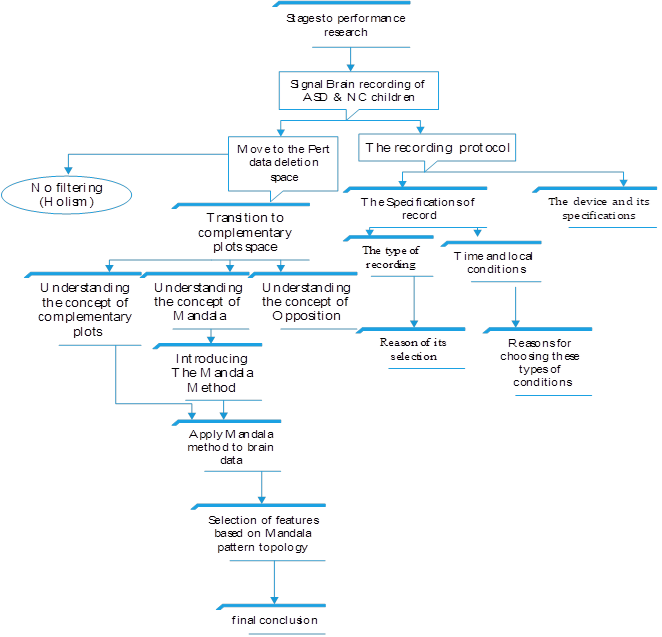


Table 1. Values of four features for NC and ASD groups in the first stage of recording on both channels
Table 2. Values of the four features for the NC and the ASD groups in the second recording stage on both channels
Full-Text: (1093 Views)
Background
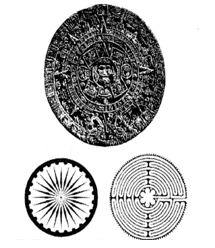
Chaotic theories, tools, and the concept of information can be used to understand the dynamics of the brain and develop new methods for the diagnosis of brain pathologies. Different processes in the universe are carried out due to coexistence co-ordination between complementary and yet opposite actions. In this regard, one can refer to a series of biological activities and processes within the body for the regulation of heart rate that accelerates the sympathetic nerves and decelerate parasympathetic nerves [1,2]. The Mandala pattern used in this study is an archetype used in many religious traditions (Figure 1) [3].
According to the global definition, ASD is characterized by problems and challenges in social interaction, communication, and the tendency to perform repetitive behaviors [4].
Complementary charts depict a pattern in all NC subjects during the heartbeat intervals (Figure 2) and large numbers of cardiac and psychiatric patients. No Mandala pattern was observed in the heart rate record of patients with severe cardiac dysfunction or some psychiatric patients regardless of treatment with antipsychotic medicine [5,6].
Figure 1. Mandala archetypes: Aztec sundial (top). The wheel in the Indian flag (left) is originated from Buddhism and Gandhi’s Spinning wheel. Chartres Cathedral Labyrinth (right)
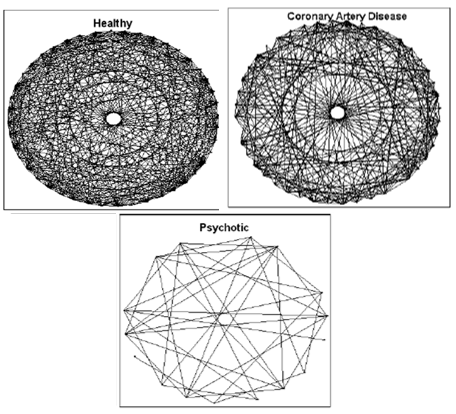
Figure 2. There are six rings in the RRI series of a healthy person (top left) and the circle inside is empty. Mandala pattern is often shown for patients with coronary artery disease (top right); however, it is absent in patients with severe psychosis (down in the middle).
In the past few years, some studies have been carried out using the Mandala pattern on brain data including that conducted by Sadeghi Bajestani et al. (2017) in which two groups of control and ASD were used and the results were consistent with those of the present study. In this study, the Mandala pattern was used as the main strategy for distinguishing ASD from NC individuals, since this pattern was not formed in the NC group [7].
Materials and Methods
No filters have been used in the present study since based on the authors’ viewpoint, there is no standard method to eliminate undesirable items from the vital signal without jeopardizing the information and creativity. It is worth mentioning that part of the important information was lost due to the application of conventional filters [8,9,10]. The block diagram of this study is presented in Figure 3.
Recording Protocol in Research
The recording was carried out using a 10-20 system, a well-known international method. This system consists of several electrodes, the positions of which are shown in Figure 4.
In total, 10 individuals out of 20 participants in this study had ASD and the other 10 were included in the NC group. The mean ±SD age of participants was estimated at 8±5 years old. The recording was performed in an acoustic room equipped with a chair and a monitor to display cartoons for both groups.
Recording steps; content and time specifications; method of implementation of triple recording steps
In the first stage (or baseline), the child sat motionless on a chair for about one minute in a completely normal form. In the next stage, a cartoon was played for five minutes with sound. Afterward, the same cartoon was displayed again soundless. Recording for all NC children was performed similarly. In the stage when cartoons were displayed with sound, such questions as word completion and word guesses were raised for autistic children. In the third stage, the same images (including objects, animals, and fruits) were displayed without background sound.
Recording data tool
The recording device and software used in this study included FlexComp Infiniti Encoder and BioGraph Infiniti, respectively. The device (256 Hz, 12-bit ADC) had the capability to record and collect biological data from brain activity online and synchronously.
Opposite concept
Although the universality of duality has been widely recognized, there are divergent views as to the nature of the opposition. Oppositions change performance and hence produce information. Information is encoded in opposition, examples of which include positive and negative states of computer components, true and false in logic, action, and resting potential in neurons [11]. The computation of sine and cosine of each term in a time series allows one to explore the opposite components of a process when only a one-time series is available. The interaction of opposites plays a fundamental role in natural and human processes. The sine and cosine of each term in the series were calculated to investigate the opposition. As a result, a single time series was decomposed into two complementary surrogate series (sine and cosine transform). Sine and cosine are an example of complementary opposites, they wax and wane out of phase (displayed by pi/2). It should be noted that such rising and falling do not occur independently. Sine and cosine transform lead to the provision of a two-dimensional framework to project a time series and examine the relationship between the opposite components. Trigonometric transformations were introduced as a strategy to develop numerical analyses and plots [12].
Trigonometric model
Trigonometric analysis decomposes a complex series into two orthogonal and opposite components. Trigonometric transformations are widely used in time series analysis. Fourier analysis decomposes a complex time series into a (potentially infinite) series of sine and cosine components. The trigonometric decomposition into sine and cosine components portrays informational oppositions. The relation between sine and cosine functions is considered as a mathematical model for complementary opposition since they include reciprocity and orthogonal relations [12]. Linear (diagonal), orthogonal (two linear orthogonal opposite), and partial (dotted lines in each semicircle) opposites are presented in Figure 5.
Complementary plots
Complementary plots are generated by plotting the cosine and sine transforms in X and Y axes as well as drawing a straight line between successive points to represent transitions. In the complementary plot, the value of each term in the time series corresponds to a point in a circumference (Figure 6). The vertical axis represents the sine scale while the horizontal axis denotes the cosine scale, with zero in both scales corresponding to the center of circumference [12]. The Mandala pattern was achieved from the successive transitions between the sinus and cosine. The evaluation of brain data between the NC and ASD groups was carried out based on this pattern.
Figure 3. Block diagram of the stages of the study

Figure 4. The method of electrode placement in the 10-20 international system and the channels
Figure 5. Vector representation of linear (polar), orthogonal (complementary dialectics), and partial opposites in the trigonometric circle
Figure 6. Numbers on the circumference correspond to values in the biological series [5]
Introduction of topological features of Mandala pattern and evaluation method
In this study, several features of the Mandala pattern compared between the two groups include:
1. Central Circular Status (SCC),
2. Number of Concentric Rings (NCR) in Mandala structure,
3. Pattern Detection Capability (PDC). The evaluation method of Mandala patterns based on the selected features is as follows: In the first feature, in case of the formation of a central circle in the pattern and the absence of any diameter from its inside, the number one was ascribed; otherwise, a zero number was assigned. In the second feature, a number of the same concentric loops in the Mandala pattern was counted and evaluation was carried out based on the number of loops in the Mandala standard pattern (6 loops) and the results were compared between the two ASD and NC groups. Eventually, in the third
Figure 7. Evaluation method of the features extracted from Mandala topology
feature, the two previous features had to have a value of one, so that the third feature took the value of one. In case one of the two previous features was zero, the value of the third feature evaluation was reported as zero. The evaluation of these features is presented by providing two examples in Figure7.
Results and Discussion
Given the three mentioned features, the brain signal of autistic children was taken into account as a time sequence to examine the patterns of Mandala
Results and Discussion
Given the three mentioned features, the brain signal of autistic children was taken into account as a time sequence to examine the patterns of Mandala
Figure 8. Mandala patterns of the second and third recording steps for NC and ASD individuals on both channels
produced from the two C3 and C4 channels. Mandala pattern was obtained by calculation of the sinus based on cosine. Regarding the sampling frequency of 256 Hz, this pattern was repeated every four seconds.
Results were collected in Tables 1-3. In Figure 8, samples of brain signals of the third person in NC and the fifth person in the ASD group are demonstrated for the second and third stages of recording in both channels.
It should be noted that two features of SCC and NCR are present in the third feature, which is PDC, and they are synergistic (Figure 7). In Figure 8, the variable behavior of the Mandala pattern can be observed in the face of the brain signal of the NC and ASD groups. According to the given explanations, the results of the investigation are presented in Tables 1-3 based on these features. The numbers, which have been specified in Tables 1-3 are the maximum values for each feature. These values are provided in a general table with coordinates, such as channel type, type of feature, state of health, and the recording step [Table 4]).
As shown in Table 4, the number of central circles observed in NC cases is more than those with ASD. Regarding the number of loops formed in the Mandala pattern, it should be noted that the highest number of loops is devoted to autistic individuals. Eventually, the Mandala pattern was formed and observed more in ASD compared to the NC group. Regarding the Mandala tables and expressed points, regular and almost regular patterns (otherwise known as Mandala, and pseudo- Mandala patterns) were more common in people with autism disorders.
Statistical test
Paired t-test is used to study and compare two dependent variables (comparison of averages of two variables). All three attributes in each group
Table 1. Values of four features for NC and ASD groups in the first stage of recording on both channels
| C3_baseline.ASD | SCC | NCR | PDC | C4_baseline.ASD | SCC | NCR | PDC |
| #1 | 2 | 14 | 0 | #1 | 0 | 14 | 0 |
| #2 | 10 | 28 | 9 | #2 | 9 | 23 | 5 |
| #3 | 0 | 14 | 0 | #3 | 1 | 14 | 0 |
| #4 | 4 | 16 | 3 | #4 | 8 | 23 | 11 |
| #5 | 8 | 44 | 7 | #5 | 9 | 49 | 6 |
| #6 | 12 | 42 | 9 | #6 | 10 | 32 | 6 |
| #7 | 5 | 24 | 4 | #7 | 2 | 16 | 1 |
| #8 | 2 | 16 | 0 | #8 | 2 | 19 | 1 |
| #9 | 4 | 20 | 0 | #9 | 5 | 24 | 2 |
| #10/ | 0 | 14 | 0 | #10 | 2 | 16 | 1 |
| C3_baseline.NC | SCC | NCR | PDC | C4_baseline.NC | SCC | NCR | PDC |
| #1 | 13 | 25 | 14 | #1 | 14 | 40 | 13 |
| #2 | 3 | 20 | 3 | #2 | 4 | 22 | 2 |
| #3 | 1 | 16 | 1 | #3 | 1 | 16 | 1 |
| #4 | 1 | 3 | 1 | #4 | 1 | 3 | 1 |
| #5 | 0 | 14 | 0 | #5 | 0 | 14 | 0 |
| #6 | 0 | 14 | 0 | #6 | 0 | 14 | 0 |
| #7 | 3 | 18 | 1 | #7 | 0 | 14 | 0 |
| #8 | 0 | 14 | 0 | #8 | 0 | 14 | 0 |
| #9 | 6 | 26 | 6 | #9 | 5 | 24 | 5 |
| #10 | 2 | 18 | 2 | #10 | 1 | 16 | 1 |
Table 2. Values of the four features for the NC and the ASD groups in the second recording stage on both channels
| C3_withvoice.ASD | SCC | NCR | PDC | C4_withvoice.ASD | SCC | NCR | PDC |
| #1 | 0 | 73 | 0 | #1 | 0 | 73 | 0 |
| #2 | 10 | 92 | 70 | #2 | 4 | 80 | 70 |
| #3 | 0 | 73 | 0 | #3 | 1 | 74 | 0 |
| #4 | 24 | 55 | 30 | #4 | 45 | 159 | 70 |
| #5 | 36 | 99 | 36 | #5 | 4 | 91 | 4 |
| #6 | 0 | 73 | 0 | #6 | 1 | 75 | 1 |
| #7 | 1 | 74 | 0 | #7 | 3 | 78 | 0 |
| #8 | 0 | 73 | 0 | #8 | 3 | 78 | 0 |
| #9 | 15 | 90 | 1 | #9 | 0 | 73 | 0 |
| #10 | 4 | 79 | 2 | #10 | 8 | 86 | 3 |
| C3_withvoice. NC | SCC | NCR | PDC | C4_withvoice.NC | SCC | NCR | PDC |
| #1 | 45 | 211 | 37 | #1 | 32 | 134 | 37 |
| #2 | 12 | 97 | 12 | #2 | 3 | 79 | 3 |
| #3 | 5 | 81 | 3 | #3 | 1 | 75 | 0 |
| #4 | 4 | 77 | 4 | #4 | 3 | 76 | 3 |
| #5 | 57 | 197 | 43 | #5 | 29 | 114 | 27 |
| #6 | 0 | 73 | 0 | #6 | 2 | 75 | 0 |
| #7 | 8 | 85 | 6 | #7 | 0 | 73 | 0 |
| #8 | 4 | 78 | 1 | #8 | 0 | 73 | 0 |
| #9 | 4 | 77 | 0 | #9 | 3 | 75 | 0 |
| #10 | 25 | 125 | 19 | #10 | 16 | 108 | 12 |
Table 3. Values of the four features for the NC and the ASD groups in the third recording stage on both channels
| C3_withoutvoice.ASD | SCC | NCR | PDC | C4_withoutvoice.ASD | SCC | NCR | PDC |
| #1 | 1 | 75 | 1 | #1 | 1 | 75 | 1 |
| #2 | 4 | 71 | 17 | #2 | 4 | 71 | 17 |
| #3 | 4 | 74 | 0 | #3 | 0 | 73 | 0 |
| #4 | 71 | 213 | 68 | #4 | 61 | 199 | 63 |
| #5 | 38 | 51 | 13 | #5 | 5 | 83 | 2 |
| #6 | 53 | 164 | 18 | #6 | 36 | 143 | 13 |
| #7 | 0 | 73 | 0 | #7 | 1 | 74 | 0 |
| #8 | 10 | 85 | 1 | #8 | 11 | 87 | 3 |
| #9 | 8 | 56 | 0 | #9 | 9 | 60 | 0 |
| #10 | 5 | 79 | 0 | #10 | 6 | 83 | 0 |
| C3_withoutvoice.NC | SCC | NCR | PDC | C4_withoutvoice.NC | SCC | NCR | PDC |
| #1 | 65 | 144 | 21 | #1 | 48 | 131 | 10 |
| #2 | 16 | 105 | 17 | #2 | 15 | 96 | 9 |
| #3 | 0 | 73 | 0 | #3 | 0 | 73 | 0 |
| #4 | 11 | 95 | 11 | #4 | 8 | 87 | 8 |
| #5 | 32 | 121 | 30 | #5 | 0 | 73 | 0 |
| #6 | 6 | 83 | 4 | #6 | 6 | 82 | 3 |
| #7 | 12 | 16 | 4 | #7 | 0 | 73 | 0 |
| #8 | 0 | 73 | 0 | #8 | 0 | 73 | 0 |
| #9 | 9 | 88 | 6 | #9 | 3 | 78 | 2 |
| #10 | 24 | 116 | 10 | #10 | 23 | 109 | 9 |
were studied separately and comparatively using paired t-test (P=0.05). The final result was included in Table 5. Based on the mentioned table, the different states of the two groups of ASD and NC were compared with each other to analyze the results in all parameters of the t-test. No results were achieved in the corresponding comparison of the channels (C3- C3 [NC-ASD] and C4-C4 [NC-ASD]) of two groups in the first state.
In the second state (state 2) the comparison of two channels in each group (C3-C4 [ASD] or C3-C4 [NC]) was carried out separately, and C3 and C4 represent the left and right hemisphere, respectively. This state is the analysis of the concept of hemispherical asymmetry in which the NC group has a higher significance level compared to the ASD group.
In all topological features of Mandala, the PDC feature had the highest frequency in the (paired) t-test. State 2 refers to the status of mirror neurons and their dysfunction in children with ASD. The investigation of this matter has been one of the objectives of the recording protocol that has already been discussed (Section 2.3).
According to Figure 7, it should be noted that the other two features (i.e. SCC and NCR) form the third feature (PDC) synergistically. A single-star and two-star symbols are used for values less than 0.05 and less than 0.005, respectively.
Table 4. Maximum values obtained in Tables 1-3
| Feature | NSCC1 | Max | NPDC | Max | NCR | Max |
| C3_baseline | NC | 13 | NC | 14 | ASD | 44 |
| C4_baseline | NC | 14 | NC | 13 | ASD | 49 |
| C3_withvoice | NC | 57 | ASD | 70 | NC | 211 |
| C4_withvoice | ASD | 45 | ASD | 70 | ASD | 159 |
| C3_withtuovoice | ASD | 71 | ASD | 68 | ASD | 213 |
| C4_withoutvoice | ASD | 61 | ASD | 63 | ASD | 199 |
1 Number (feature)
Table 5. A summary of t-test results in three stages of recording
Table 5. A summary of t-test results in three stages of recording
| Paired Samples Test | Paired Samples Correlations | State (Baseline) | |||||||
| State(2) | State(1) | State(2) | State(1) | ||||||
| NC | ASD | C4-C4 | C3-C3 | NC | ASD | C4-C4 | C3-C3 | ||
| 0.434 | 0.885 | 0.330 | 0.399 | 0** | 0.001** | 0.325 | 0.48 | SCC | |
| 0.599 | 0.914 | 0.329 | 0.178 | 0.001* | 0.001* | 0.440 | 0.73 | NCR | |
| 0.015* | 0.928 | 0.625 | 0.856 | 0** | 0.078 | 0.344 | 0.294 | PDC | |
| Paired Samples Test | Paired Samples Correlations | State (with voice) | |||||||
| State(2) | State(1) | State(2) | State(1) | ||||||
| NC | ASD | C4-C4 | C3-C3 | NC | ASD | C4-C4 | C3-C3 | ||
| 0.021* | 0.642 | 0.755 | 0.230 | 0** | 0.199 | 0.687 | 0.211 | SCC | |
| 0.055 | 0.450 | 0.898 | 0.068 | 0** | 0.116 | 0.756 | 0.309 | NCR | |
| 0.029* | 0.871 | 0.557 | 0.865 | 0** | 0.004** | 0.606 | 0.507 | PDC | |
| Paired Samples Test | Paired Samples Correlations | State (voiceless) | |||||||
| State(2) | State(1) | State(2) | State(1) | ||||||
| NC | ASD | C4-C4 | C3-C3 | NC | ASD | C4-C4 | C3-C3 | ||
| 0.058 | 0.126 | 0.722 | 0.865 | 0.002** | 0** | 0.682 | 0.635 | SCC | |
| 0.875 | 0.641 | 0.642 | 0.897 | 0.026* | 0** | 0.883 | 0.884 | NCR | |
| 0.059 | 0.161 | 0.344 | 0.832 | 0.289 | 0** | 0.265 | 0.651 | PDC | |
Conclusions
The EEG signal appears to be composed of delayed potentials, which are classified into excitatory and inhibitory categories [13]. ASD is a software disorder (in the interaction of various brain regions) that results in secondary hardware problems [14]. The results indicate that all features in the ASD group were maximal compared to the NC group. According to the statistical analysis of these features, the PDC was introduced as an optimal feature to differentiate NC from ASD groups. In general, these results indicate that there are more periodic episodes in the brain signal of autistic children and that the brain does not have the normal symmetry. In other words, the excitatory and inhibitory imbalance is the origin of many abnormalities in people with autism [14].
Compliance with Ethical Standards
Conflict of Interest
The authors declare that they have no conflict of interest regarding the publication of the present study.
Ethical approval
All procedures performed in studies involving human participants were conducted base on the ethical standards of the respective institutions and/or national research committee and in accordance with the 1964 Helsinki Declaration and its later amendments or comparable ethical standards.
Informed consent
Informed consent was obtained from all participants in the present study.
References
- Gao J, Hu J, Tung WW. Complexity measures of brain wave dynamics. Cognitive Neurodynamics. 2011; 5(2):171-82. [DOI:10.1007/s11571-011-9151-3] [PMID] [PMCID]
- Malik M, Camm AJ. Heart rate variability. Clinical Cardiology. 1990; 13(8):570-6. [DOI:10.1002/clc.4960130811]
- Sabelli H. Bios: a study of creation (With CD-ROM). Singapore: World Scientific; 2005. P. 189-90.
- Whitman BY, Accardo PJ. Dictionary of developmental disabilities terminology. London: Reference Services Review; 1996
- Sabelli H. Bios: a study of creation (With CD-ROM). Singapore: World Scientific; 2005
- Sabelli H. Complement plots: analyzing opposites reveals Mandala-like patterns in human heart beats. International Journal of General System. 2000; 29(5):799-830. [DOI:10.1080/03081070008960973]
- Bajestani GS, Golpayegani MR, Sheikhani A, Ashrafzadeh F. Poincaré section analysis of the electroencephalogram in autism spectrum disorder using complement plots. Kybernetes. 2017; 46(2):364-82. [DOI:10.1108/K-12-2015-0306]
- Sabelli H. Bios: a study of creation (With CD-ROM). Singapore: World Scientific; 2005. P. 120-2.
- Sabelli H. Bios: a study of creation (With CD-ROM). Singapore: World Scientific; 2005. P. 45-9.
- Nasr Azadani S, Ghamarani A, Yar Mohammadian A. Mirror neurons and role of them in imitation and theory of mind in autism spectrum children. Exceptional Education Journal. 2013; 8(121):42-8.
- Sabelli H. Bios: a study of creation (With CD-ROM). Singapore: World Scientific; 2005. P. 192-3.
- Sabelli H. Bios: a study of creation (With CD-ROM). Singapore: World Scientific; 2005. P. 191-2.
- Nelson SB, Valakh V. Excitatory/inhibitory balance and circuit homeostasis in autism spectrum disorders. Neuron. 2015; 87(4):684-98. [DOI:10.1016/j.neuron.2015.07.033] [PMID] [PMCID]
- Sadeghi Bajestani G, Sheikhani A, Hashemi Golpayegani SM, Ashrafzadeh F, Hebrani P. A systematic review, on the application of quantitative EEG for characterizing autistic brain. Journal of Modern Rehabilitation. 2016; 9(6):10-28.
Article Type: Research Article |
Subject:
Child / Geriatric Psychiatry
Received: 2020/03/27 | Accepted: 2020/09/14 | Published: 2021/06/20
Received: 2020/03/27 | Accepted: 2020/09/14 | Published: 2021/06/20
Send email to the article author
| Rights and permissions | |
 |
This work is licensed under a Creative Commons Attribution-NonCommercial 4.0 International License. |
Articles Copyright © The Author(s).
Owned by Hamadan University of Medical Sciences.
Published by UMSHA Press
Journal Tel: +989025126654
Publisher Tel: +985136014377
Website: http://ajnpp.umsha.ac.ir
Email: avicennajnpp[at]gmail.com
